
Current Issue
Design and Implementation of Multi Facility Power Postpaid Meter with Bluetooth Control
Visa M. Ibrahim1, Braimoh Aliyu2, S. Y. Musa1
Department of Electrical and Electronics Engineering, Modibbo Adama University, Yola Adamawa state, Nigeria.
1email: imvisa@mau.edu.ng, 2email: aliyu.braimoh@zenithbank.com, 3email:saiduymusa@mau.edu.ng,
-------------------------------
ABSTRACTWelcome to the world of Nigerian electrical utilities, where we have the centralized metering infrastructure (CIM), which is either at the distribution poles or at the consumer premise, allowing easy billing. Nevertheless, aggregation energy usage in communal residential organizations with several households is difficult to be manually allocated, triggering disputes when occupants refuse to pay according to their allocated portion. To ameliorate this inefficiency, this study proposes and prototypes a multi-node (five-node) smart metering system featuring Bluetooth-enabled control. The approach focused onthe creation of an embedded system architecture, integrating ambient sensors and a microcontroller to automatically measure and estimate household consumption at the individual level. Cost allocation, based on power consumption data from each node was automatically processed using computer algorithms,eliminating the need for human intervention. The real-time data and user interaction were done through a mobile application that used Bluetooth communication module. The post-implementation evaluation confirmed the effectiveness of the system in automating the equitable billing mechanism and distributing it across five households in the compound, so that trust and accountability are ensured in the process. This prototype reveals the potential for hybridizing decentralized metering technologies with networks of wireless Internet of Things (IoT), to facilitate energy management in multi-tenant settings, reduce charges disputes between consumers and suppliers due to inaccurate meters, and improve operational efficiency in utilities.
Keywords:Aggregation, Bluetooth-Enabled Control, Centralized Metering Infrastructure (CIM), Computer Algorithms, Easy Billing, Embedded System Architecture, Inefficiency, Multi-Node (Five-Node), Smart Metering System, Multi-Tenant Settings, Operational Efficiency, Wireless Internet of Things (IoT).
1. INTRODUCTIONAnalogue meters were introduced into the Nigerian electricity system. The issue with traditional electromechanical induction meters in a typical multi-facility or multi-apartment is bill quota allocation. In Nigeria, that is significantly reduced by the introduction of digital prepaid meters to individuals. There are basically two types of meters: the analogue (electromechanical) and the digital (electronic) meter. Electronic meters display the energy used on an LCD or LED display, and some can also transmit readings to remote places wirelessly [1], [2].
This research work is important because it offers solution to multi-facility bill splitting. This means in a household with multiple tenants this research work found a way to split the bill according to the consumption of the different apartment in the household. Before now, the tradition was to have a common bill for the entire household and have each apartment manually determining their bill by splitting the bill equally which could be grossly unfair to some apartment with fewer appliance [3].
Electronic meters were meant to be a more effective way of determining electricity consumption by users more accurately [2]. However, the method used by landlords and caretakers to eliminate per-user consumption quota allocation of electricity bills which is a reason for conflict in off-campus student hostels, commercial facilities and households, is to use multiple meters for multiple facilities: a meter for each individual. While this solves the problem, it does so at multiples of the cost of metering. This research work therefore aims to solve this problem by developing a simple embedded system prototype programmed to do the bill splitting.
2. METHODOLOGYIn their thesis Hart, G.W. [4],[5] noted that, a meter was designed to measure current, voltage while keeping track of date and time for accurate data logging. It was designed to operate on a single phase and supply a unit facility. Great efforts were put into ensuring that the meter is made tamper-proof as an accelerometer was embedded into it to detect when the meter is moved out of its original installation place. Communication with a host computer was done over RS-485 protocol because of its higher speeds over longer ranges. This meter also lacks the ability to meter multiple facilities within the same device [6].
Stephen A. Dyer [7] designed a system aimed at monitoring power consumption on a device level, it connects to a Wi-Fi hotspot for data logging and displays the real-time consumption of that connected device to the user on a screen. This device proves to be useful only if the power consumption of a certain device is under investigation. It does not address the issue of tracking the consumption of the entire facility let alone multiple facilities.
Ricks, G.W.D [6] pointed out the problem very clearly; but upon a closer look at the implementation part of the thesis, there is no means of current sensing individual load current meaning a user’s energy consumption is also estimated. What was done is basically one meter with multiple outputs and not a true multi-user meter.
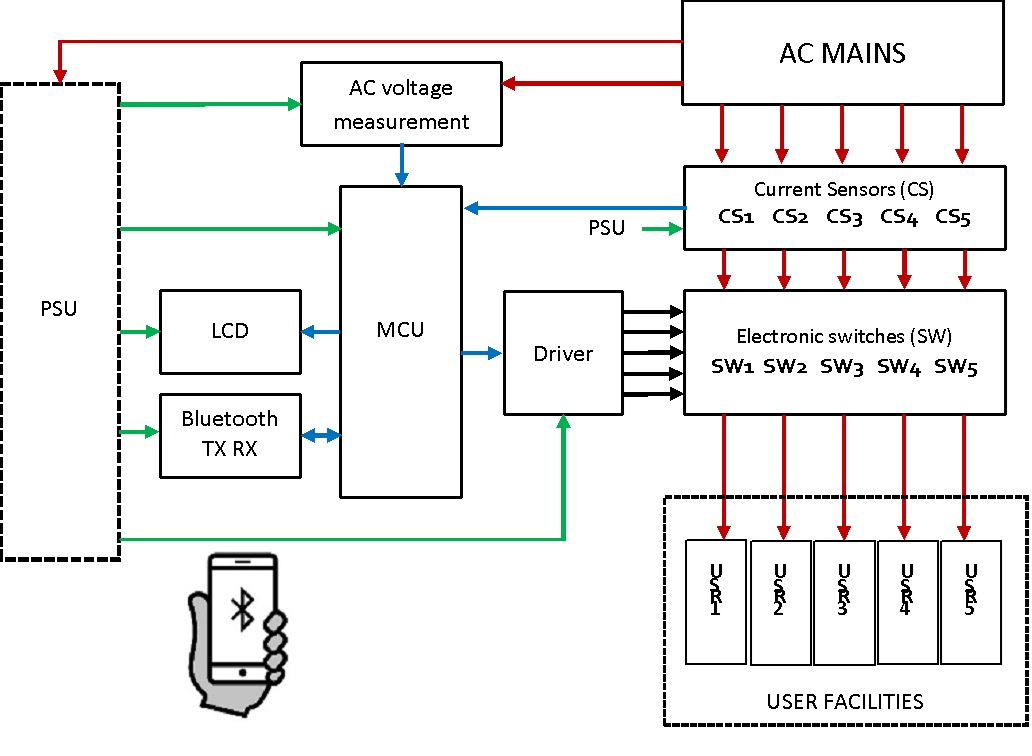
3. METHODS3.1 Block Diagram
3.2 Power Supply (PSU) design
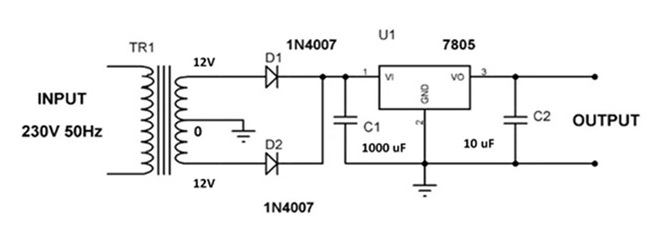
Figure 2 below shows the 5V power supply designed for the energy meter. A center tap 12-0-12V, 500 mA transformer is used in this design such that part of the 12V of the secondary goes to a voltage regulator to power the controller, the display, the Bluetooth module, the buzzer and the GSM module. The other 12V is used in designing the circuit for measuring the AC voltage. Both circuit share a common ground at the center tap. Sharing common ground is necessary for the voltmeter circuit that will be connected to the controller’s analog channel. After rectification by D1 and D2, the ripple laden voltage is passed to a capacitor for filtering. The following calculations were made when selecting the filtering capacitor C1.
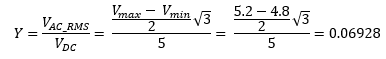
The ripple factor, Y, is given by the expression:
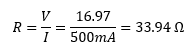
R is resistance calculated
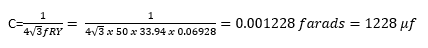
And C is the capacitance to be calculated
The peak secondary voltage of the 12 volt, 500 mA transformer is 12√2 = 16.97V
Therefore
The capacitor C2 is selected according to the datasheet of lm7805 voltage regulator. According to datasheet a capacitor between 1 µf and 10 µf can be placed at the output (Texas Instrument, 2009).
3.3 AC voltage measurementFigure 3 below shows the design of the AC voltage measuring circuit
Therefore, substituting the values of R, Y and F into equation (1) and making C subject of formula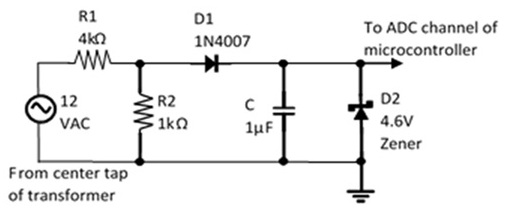
The 12V output from the transformer is fed into the AC voltage sensing circuit. This AC voltage is rectified to DC using diode D1 and smoothing is done using capacitor C. The microcontroller used in this design cannot withstand any voltage greater than 5V even to its analog to digital (ADC) channel and so voltage divider circuits is design using resistors R1 and R2. It is also intended that when the AC voltage is 220V and the secondary is 12V then a maximum of 2.5V should appear at the ADC channel of the controller. This value can be higher if the input voltage exceeds 220V. And so 2.5V was considered as a safe voltage for the ADC channel of the microcontroller. If a higher voltage, say close to 5V was chosen then the possibility of this voltage exceeding 5V when the AC voltage increases above 220V is high and this could lead to inaccurate readings, as the zener diode will block the excess 5V. As a precautionary measure, also, a 4.6V zener diode is placed across the ADC channel of the controller to restrict the voltage to less than 5V.
Based on all these considerations, the selection of R1 and R2 is done as follows:
From ohms law, V = IR
Where V is voltage = 12VAC
I is current and
R is equivalent resistance = R1 + R2
Therefore, current flowing through the circuit will be
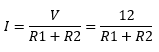
But voltage drop across R2 is, V=IR=I×R2=2.5V

⇒12R2=2.5R1+2.5R2
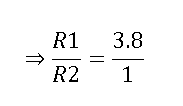
Therefore, the ratio of R1 to R2 is approximately 4 to 1 and so R1 was selected as 4kΩ while R2 was selected as 1kΩ. It is completely safe to select 4kΩ especially when resistor tolerance is considered. Also, the transformer used is rated 220V to 12V at both windings in the secondary. If the transformer ratio is designated N, then:

The ADC channel of the controller used in this design is a 10 bit ADC channel. This means that when 0 to 5V is fed to the ADC channel of controller it will correspond to a value that is between 0 and 210. This is same as 0 to 1024. That means if y volt is fed to the ADC channel, the value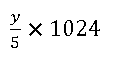 will be returned as the analog equivalent.
Given all these parameters, the following formula was established and programmed into the controller for calculating the AC voltage:
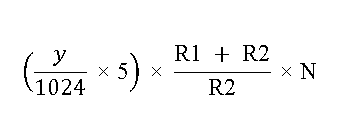
Where y is the analog value of the voltage read by controller
R1 is 4kΩ in actual sense it is approximately 3.8kΩ because of resistor tolerance R2 is 1kΩ
N is transformer turns which is 18.33
as a test, if it is intended to measure 220 VAC, this voltage goes through the voltage divider circuit and becomes 2.5 volts or
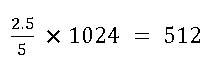
analog equivalent.
this means that the controller reads the 220 VAC as 512 and passes this value into the above formula
(which will be programmed into the controller)
so, substituting we have:
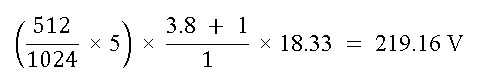
Which concludes how the controller measures AC voltage in this design.
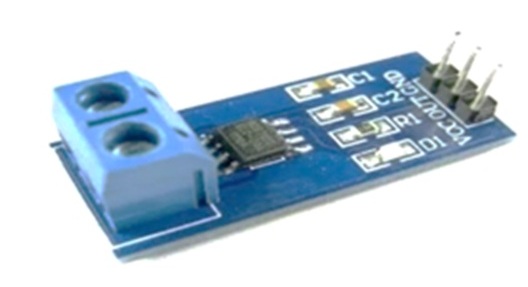
3.4 Interfacing Current sensor with MicrocontrollerThe current sensor used in this design is an ACS758 sensor. This sensor is capable of measuring up to 30A of both DC and AC current [8]. Figure 4 shows the diagram of this sensor.
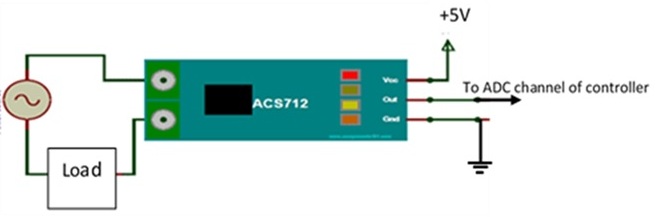
The current sensor is interfaced to the controller and programmed to read current. Figure 5 shows how the sensor is interfaced with a controller. The out pin is connected to the ADC channel of a controller while vcc and ground pins are connected to 5V and ground respectively.
3.5 Microcontroller (MCU)
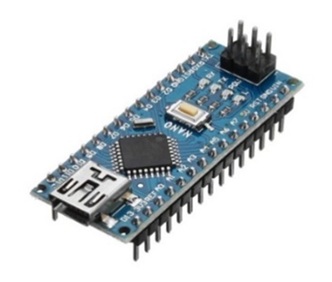
The microcontroller used in this project is an arduino nano equipped with an ATMEGA328P chip. This controller was the preferred choice for this project because of the relative ease with which it takes to program the controller. This controller, apart from the Atmega328 chip, is also equipped with a CH340 chip that enables serial communication with a computer through a universal serial bus (USB) mini B cable [4]. This eliminates the need to purchase any third party programmer and so codes or software written in the C/C++ programming language is burnt directly into the memory of the controller through a USB cable.
Onboard the controller are also 5V and 3.3V regulators. All these components, combined, makes it extremely easy to use the arduino nano microcontroller.
A microcontroller is a miniaturized computer with a central processing unit (CPU), read only memory (ROM), random access memory (RAM) and peripherals like ADC channels, Serial communication peripherals that will be used to interface components like GSM module and Bluetooth module, and lots more. All calculations used in this design, including floating point calculations, are performed by the CPU of this controller. Figure 6 is a picture of the arduino nano controller.
3.6 Interfacing LCD display with controller
This design incorporates an LCD display unit meant for displaying the voltage, current, power drawn and energy consumed by any load connected to it. The display is capable of displaying alphanumeric characters. The LCD module used in this project is a QAPASS 1602A 16x2 LCD module and has a SPLC780D1 or equivalent controller which is a Chip On Board (COB) (T1NSHARP LCD module Data Sheet, 2009).
Figure 7 shows the pin out of a 16x2 LCD display.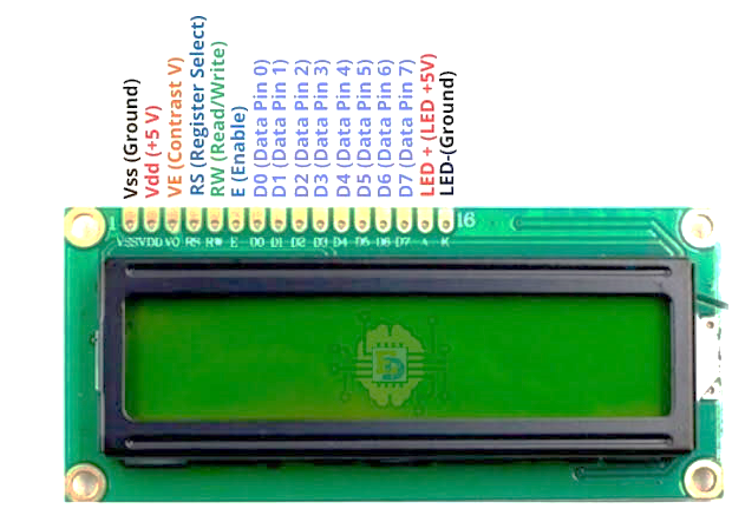
The 20x4 lcd display can be configured in 4bit mode or 8bit mode. When configured in 4bit mode only 4 pins of data bus (D4 – D7) are required to interface whereas when configured in 8bit mode all 8 pins of data bus (D0 – D7) are connected to controller. In this design, 8bit mode is used due to the fact that the controller is rich in GPIO pins. Secondly, configuring in 8bit mode reduces the amount of codes required to interface with the controller.
The circuit diagram of figure 8 show how the LCD is wired / interfaced to the controller in this design. The rest of the interfacing is done in software.
3.7 Interfacing HC06 Bluetooth module to controller
The HC06 Bluetooth module used in this project is a slave device and cannot initiate communication on its own. This device is 3.3V logic device. This means the HC06 module cannot communicate with the controller using logic levels above 3.3V. Any attempt to communicate above 3.3V could damage the Bluetooth module. In other to safely communicate with the device a logic level converter circuit was designed. Figure 9 shows how the module is
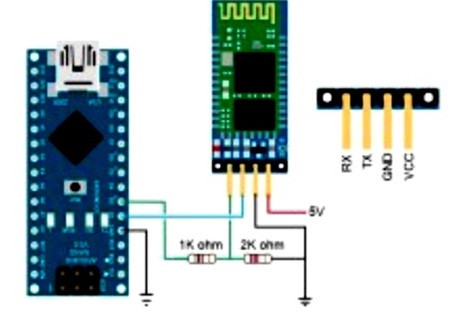
interfaced with a controller. The communication protocol used by the HC06 Bluetooth module is the universal synchronous asynchronous Receiver Transmitter (USART) communication protocol. At some point in communication, the HC06 sends data packets to the controller while at some other point, the HC06 receives data packets from the controller. When the HC06 sends data packets, it sends this signal through its transmitter pin at a logic level of 3.3V
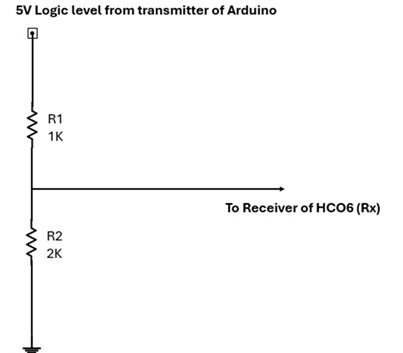
The controller is a 5V logic device but can sense logic 3.3V as a logic 1 signal. Therefore, no special circuit is needed when it receives data from HC06. However when the controller sends data to the HC06 module, it sends these data in 5V logic level and since the HC06 is a 3.3v logic device, a converter circuit need to be designed at the receiver side of the HC06 module. This design is shown in figure 10.
Let the total current flowing through the circuit be I, then using ohms law;
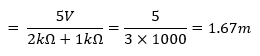
The voltage between Rx and ground is:

Where I is the current flowing through the circuit and Rx is the resistance between Rx and ground which is 2k

And so the circuit of figure 3.11 converts 5V logic level coming from Arduino to 3.33v logic level going to HC06.
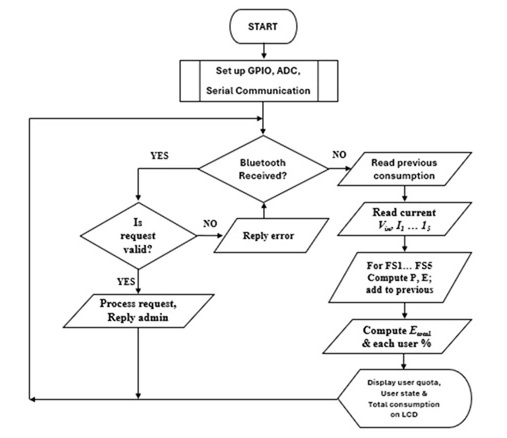
3.8 Flow chartThe algorithm used in writing the software for this research work is summarized in the flow chart of figure 11
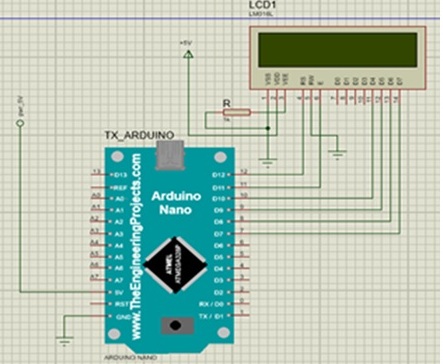
3.9 Simulation and circuit diagram
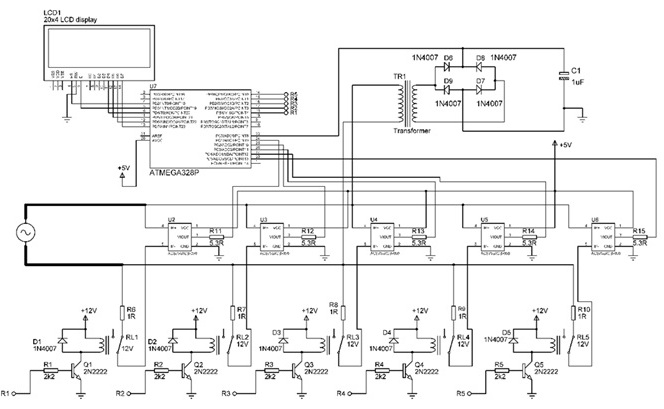
Simulation was done using the proteus 6.0 professional circuit design suit. The schematic diagram of the circuit was drawn in the proteus environment while the software was written in the Arduino IDE. After compiling the software, it was then linked to proteus for simulation. Figure 12 show the circuit diagram in the simulation environment.
3.10 Simulation results Let the consumers of each of the five-facility billing system be regarded as FS1, FS2, FS3, FS4 and FS5. The results are therefore presented based on the following scenarios.
- No load connected on all (five) supply points
- FS2, FS4 and FS5 have loads connected as shown in table 1 below for one second.
Table 1:Users load data
S/N User Connected Load 1 FS2 10Ω 2 FS4 15Ω 3 FS5 20Ω
- System is switched off and later switched on to check if user’s consumption is saved in memory.
- FS2 cut off remotely for two seconds
The above scenarios will be applied to the simulation and also to the implemented system. Both results will be compared subsequently.
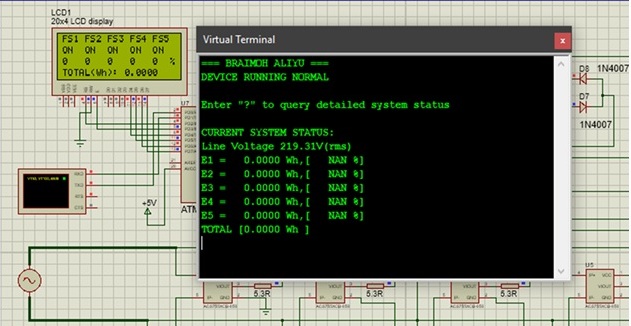
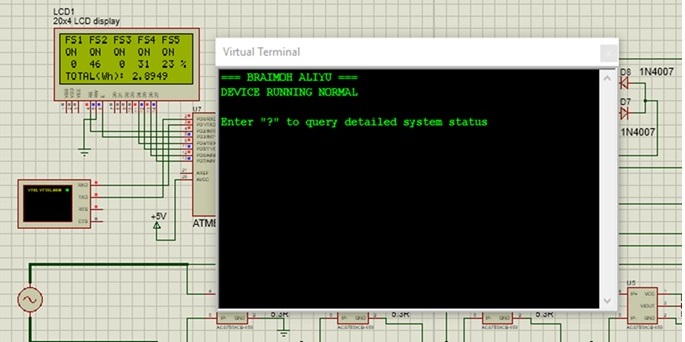
3.10.1 Simulation result when no load is connected to the systemThe simulation result when no user engages the system with any form of load is hereby presented in figure 13.
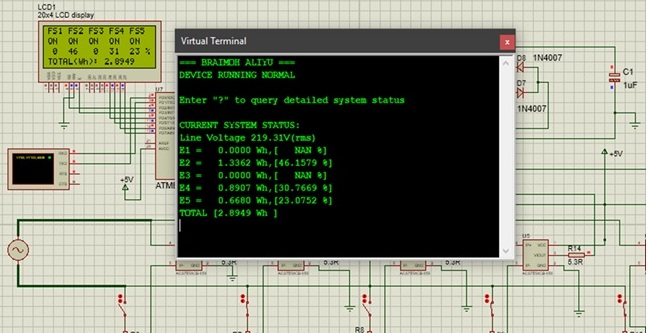
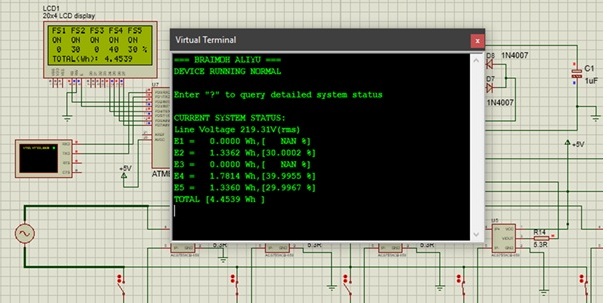
3.10.2 Simulation result when F2, F4 and F5 have loads connected as shown in table 4.1
The simulation result when FS2, FS3 and FS5 are engaged as shown in table 4.1 is presented in figure 14. Notice that switches for FS1 and FS3 are open.
3.10.3 Simulation result when the system is switched off
When the system is switched off, it is expected that the user’s consumption be stored in memory so that when power is restored, the system can resume its metering procedure for all users without losing their previous records. In simulation, loss of power is simulated by clicking the stop button of the simulator. Power restoration is simulated by clicking the play button of the simulator. Figure 15 illustrates this memory retention capability of the system.
3.10.4 Simulation result when FS2 is cut off remotely for two seconds
The next scenario happens when the user in FS2 is cut off immediately after the results shown in figure 15. If the disengagement of the user in FS2 is sustained for two seconds, the result in figure 16 ensues.
3.11 Implementation resultThe conditions or scenarios that the system was subjected to during the simulation is also applied to the implemented system. The subsections below presents results from the implemented system when subjected to the exact same conditions as the simulation.
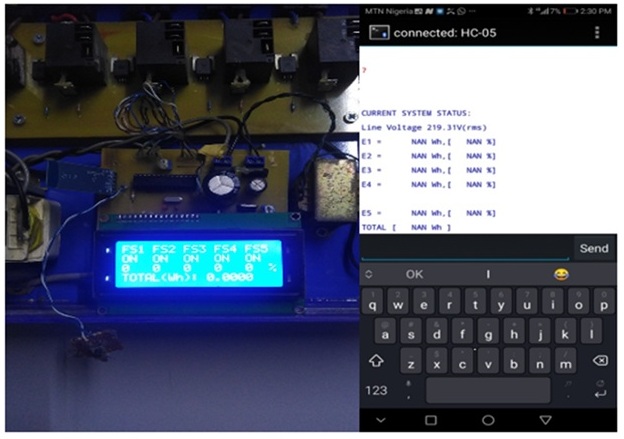
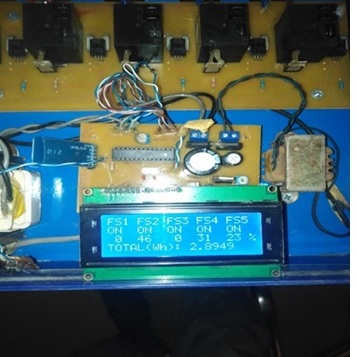
3.11.1 Implementation result when no load is connected to the systemThe implementation result when no user engages the system with any form of load is hereby presented in figure 17.
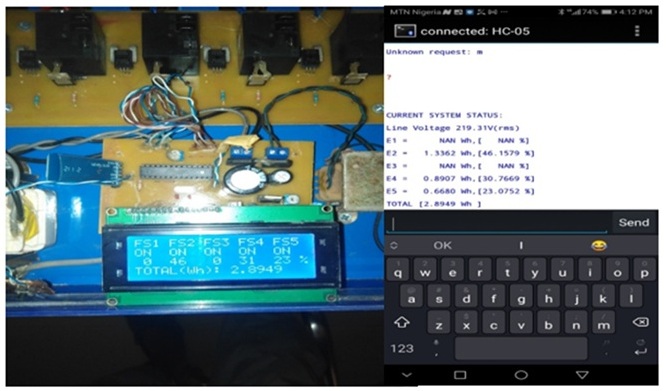
3.11.2 Implementation result when F2, F4 and F5 have loads connected as shown in table 4.1
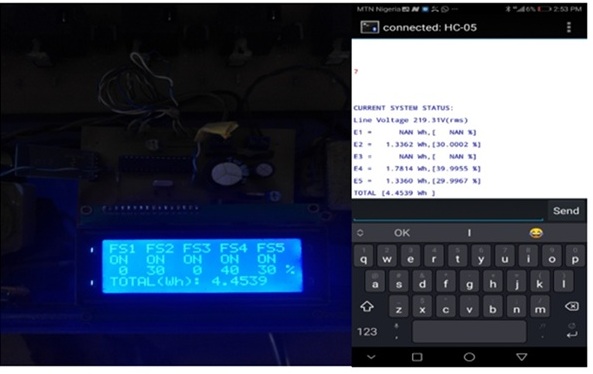
The implementation result when FS2, FS3 and FS5 are engaged as shown in table 1 for one seconds is presented in figure 18
3.11.3 Implementation result when the system is switched off
When the system is switched off, it is expected that the user’s consumption be stored in memory so that when power is restored, the system can resume its metering procedure for all users without losing their previous records. In implementation, loss of power is done simply by unplugging the system. Power restoration is done by plugging back the system. Figure 19 illustrates this memory retention capability of the system.
3.11.4 Implementation result when FS2 is cut off remotely for two seconds
The next scenario happens when the user in FS2 is cut off immediately after the results shown in figure 19. If the disengagement of the user in FS2 is sustained for two seconds, the result in figure 20 ensues.
3.12 Discussions and Result ValidationSince both simulation and implementation results are the same, only the implementation results will be discussed.
Figure 17 is the result obtained when no load from any user is connected to the system. Therefore, it is expected that their consumption be NAN, percentage be NAN or zero in the case of simulation. Figure 17 is a representation of the LCD display information and the Bluetooth serial communication information on the right.
Figure 18 is the result obtained when loads are connected to the system as depicted in table 1. As a validation of the results obtained, if for instance, FS2 connected 10 ohms of load for an hour then his energy consumption will be:

r is load resistance
Therefore FS2 energy consumption in watt hour over a period of one seconds will be:

The same calculation procedure is used to calculate the energy consumed for FS4 and FS5. The total energy consumed is therefore:
1.3360 + 0.8906 + 0.6690 = 2.8956 Wh of energy
This total energy is shown in the result of figure 4.6 which validates the result. Also if percentages were taken then:
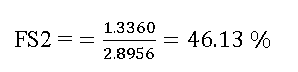

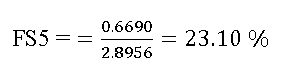
Again, this validates the result presented in figure 18
Figure 19 is merely the result showing the memory retention capability of the system. For instance, if there is a power failure and system switches off, after power restoration, the system retains the consumption of all users.
Figure 20 presents the result when FS2 user is cut off from power remotely as a result of refusal to pay electricity bills. If the cut off happens for a period of two seconds, then FS2 readings stops while the reading of FS4 and FS5 continues for the assumed two seconds. Therefore if FS4 continue to consume 15 ohms of energy then before FS2 was disengaged it would have consumed:


At this instance, FS2 was disengaged for the next two seconds. Then FS4 energy will grow, in the next two seconds, to:
EnergyFS4 = 0.8892 + 0.8892 = 1.7748 WhIf the same procedure is followed then energy consumed by FS5 will be:
EnergyFS5 = 0.6680+ 0.6680 = 1.3360 Wh
While energy consumed by FS2 will remain at 1.3360 Wh since it is disengaged. Therefore
EnergyTotal = EnergyFS2 + EnergyFS4 + EnergyFS5 = 1.3360 + 1.7748 + 1.3360 = 4.4468 Wh
And in terms of percentage:


While energies FS1 and FS3 remains 0 % since they were never engaged. Again this validates the result obtained in figure 20
4.0 CONCLUSIONThis research work entails simulating and implementing a multi-facility billing system of post-paid meter in which the energy consumption of five different facilities on the same post-paid meter is calculated and split in terms of percentage for each of the facility. This enables each consumer or facility to be able to determine it bill. Also, a Bluetooth remote control system is also simulated and implemented. The purpose is to be able to, remotely, disconnect or disengage any customers connected to any of the facility for refusing to settle their bills.
This was achieved by designing five AC current meters using sensitive current sensors and a single voltmeter circuit.
DECLARATIONS:
| Acknowledgments | : | Not applicable. |
| Conflict of Interest | : |
The author declares that there is no actual or potential conflict of interest about this article. |
| Consent to Publish | : |
The authors agree to publish the paper in the Global Research Journal of Social Sciences and Management. |
| Ethical Approval | : | Not applicable. |
| Funding | : | Author claims no funding was received. |
| Author Contribution | : |
Both the authors confirm their responsibility for the study, conception, design, data collection, and manuscript preparation. |
| Data Availability Statement | : |
The data presented in this study are available upon request from the corresponding author. |
- Arooka. "Theft of power". James Bong's Ultimate SpyGuide to Marijuana. pp. 234–242. ISBN 9780973892802.
- Eugenii Katz. "Blathy". People.clarkson.edu. Archived from the original on June 25, 2008. Retrieved 2009-08-04.
- Graeme Gooday The morals of measurement: accuracy, irony, and trust in late Victorian electrical practice, Cambridge University Press, 2004 ISBN 0-521-43098-4, p 232–241
- Hart, G.W. (June 2009). "Residential energy monitoring and computerized surveillance via utility power flows". IEEE Technology and Society Magazine. 8 (2): 12–16. doi:10.1109/44.31557. S2CID 41307271
- Minnkota Power's Load Management System Archived 2006-06-16 at the Wayback Machine, accessed 22 August 2009.
- Ricks, G.W.D. (March 2011). "Electricity Supply Meters". Journal of the Institution of Electrical Engineers. 25 (120): 57–77. doi:10.1049/jiee-1.1896.0005. Student paper read on January 24, 1896 at the Students' Meeting.
- Stephen A. Dyer (ed.) Survey of instrumentation and measurement Wiley-IEEE, 2001 ISBN 0-471-39484-X, page 875
- Texas Instrument (2014) “Datasheet for lm7805”
- Tinsharp corporation (2013) “Datasheet for LCD display”
- Verne Kopytoff; Ryan Kim (2009-02-22). "Google plans meter to detail home energy use". San Francisco Chronicle. Retrieved 2009-02-11.
- W. Bernard Carlson, Innovation as a Social Process: Elihu Thomson and the Rise of General Electric, Cambridge University Press, 2003 ISBN 0-521-53312-0, pages 1 and 258
- Whyte, Adam Gowans (2013). Forty Years of Electrical Progress. London: Ernest Benn. pp. 31, 159.